


Using Data & Technology, we're here to give your organisation the edge in discovering new and valuable Insights!
DATA VISUALISATION & BUSINESS INTELLIGENCE
We are Technolgists at heart, with a pedigree in business. We love solving problems in innovative and creative ways, by combining a rigorous approach, and our knowledge of business, to whatever project or assignment we have been challenged to work on - (and there have been many!)
We currently centre our offering around designing and building "Data Visualisation and Business Intelligence" solutions, to help organisations make better sense of their own data (whether Financial, HR, Manufacturing, Sales, Marketing, Procurement, or IT related) - so they can make better, and more informed decisions.
Examples of Past Solutions Developed:
We have built a variety of solutions across a range of industrie in the past. Here are some examples:
-
Helped an agency of an American Media, Marketing, & Corporate Communications company, quickly produce accurate and insightful reports on its Staff Utilisation levels (e.g. - rolling last 4 weeks, and last month), and Sales & Margin performance (Actuals, Forecast, and against Targets), across its International Offices and Business Practices, together with an easy and dynamic view of who its Top 'N' clients, by Sales were.
-
Helped the European Division of a Global Marketing & Advertising multi-national keep better track of its Financial Performance, covering areas such as the monthly reporting of: Actual, Budgeted, and Forecast: Sales, Profits, and Margins; Net Working Capital and Profit-to-Sales Conversion Rates - across both the short and long term)
-
Helped develop for the H.R Department of a FTSE 100 Marketing & Advertising company, reports that could deliver accurate insights into Gender Pay - covering areas such as: Staff Head Counts, Average and Median Staff Salaries, Staff Years of Service, Annual Compensation Ratios, and other Business Perks, reported by: Interntional Office, Department, and Gender
-
Helped the Finance & H.R. Departments of a U.K. Media Agency keep better track of Key Performance Indicators, relating to both Staffing and Financing, including: Client Exposure Levels (Aged Debtors, and Accrued Revenue), Total Staff Costs (Freelance and Permanent), Net Profitability (by Location, and Client), and Staff Utilisation (W.T.D. and Y.T.D. Staff Utilisations), based on a deep analysis of Timesheet data
-
Helped a FTSE 100 backed Corporate Venture Fund (funding Drinks Start-Ups), report on the Financial Performance of its Portfolio Companies, covering areas such as: Growth in Unit Volumes, and Trends in key Profit & Loss lines, such as, Net Sales, Over Heads, Net, and Gross Profit Margins, by Country and Channel, - across both "Actual" and "Budgeted" scenarios
-
Helped the Administrative & Finance Departments of a District Eye Hospital get better visibility into their Financial Performance, covering and reporting on areas such as: Revenue and Expenses; Assets and Liabilities, across all of their Hospital Units - to better identify strategic opportunities for growth, as well as areas of under and/or over investment.
-
Helped provide the Finance & Strategy Division of Middle-East based Multi-National Retailer with better visibility and insights into their spend on Facilities Management services (e.g., Cleaning, Security, Heating, Ventilation and Air Conditioning) across their entire Portfolio of Retail Stores (over 400+ stores, across 6+ countries)
Transforming (& Cleaning!) your data from a variety of both online and offline sources!
As mentioned above, your data may reside and be stored in a variety of places. For example,
-
Cloud-Based, Online sources, such as: MS Dynamics, Salesforce, and Azure Data Lake; or
-
Locally residing Offline sources, such as: Excel Workbooks, CSV, and JSON files
Depending on what your current Organisational Data Estate looks like, we will then help to gather and connect the relevant data from their different online and offline sources
Simultaneously, as we do this, we will try to also help automate any previously required manual operations that may have been needed, to get your data into a form ready that can be easily analysed and understood.
Such manual procedures may have included:
-
Manually needing to remove certain columns of data
-
Manually needing to filter and group your data
-
Manually needing to pivot and unpivot your data
-
Manually needing to append or merge rows of data with another table
-
Manually needing to split alphanumeric strings into separate columns
-
Manually having format your data (such as trim or capitalise text, or replace values)
We turn these manual "data wrangling" processes into fewer automated process, using Data Transformation Languages such as, Power Query and M-Code.

Creating Dynamic & Interactive Dashboards that bring your Data to life!
-
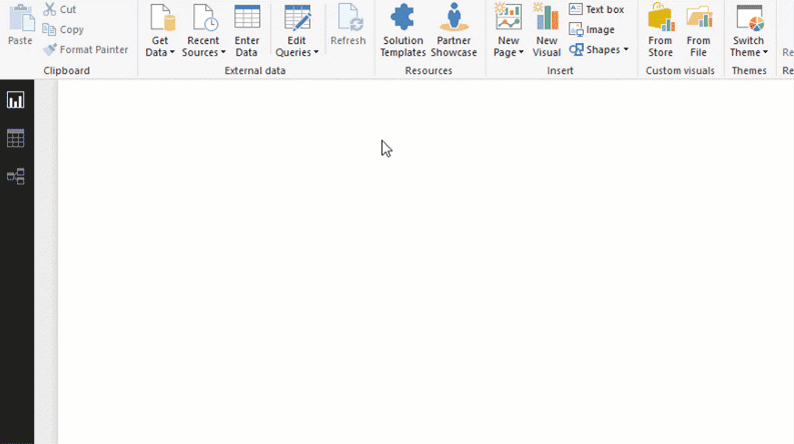
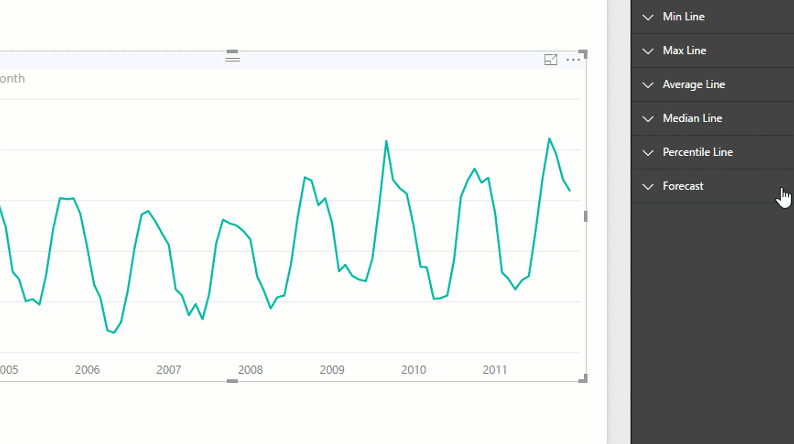
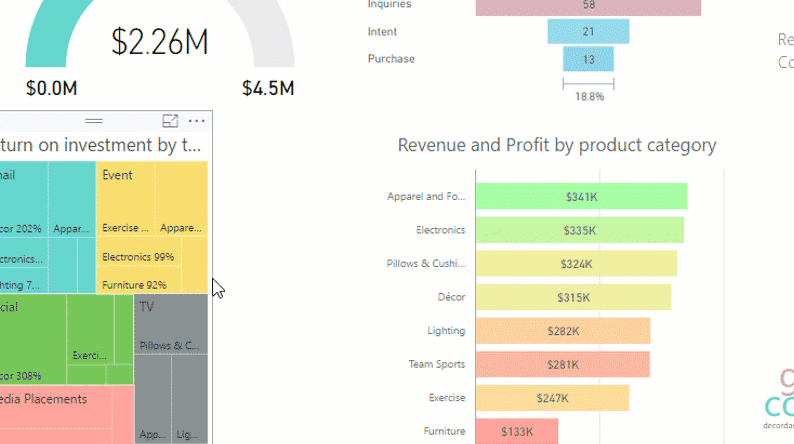
Once we have created a Data Model compatible with your organisation's Data Sources, we then create a series of "Visual Analytics Reports" (or "BI Dasboards"), to help you keep track of important business "KPIs" and "Performance Measures". We can design and build these using a variety of "Pre-built", or "Custom" visuals - whichever ones get your data across in the most effective way, for your organisation
-
Example Visuals include:
-
Simple Vertical or Horizontal Bar Charts
-
Clustered Column Charts
-
Tree Maps
-
Matrix Tables
-
Combined Line and Bar Charts
-
Donut Charts
-
Pie Charts
-
Area Charts
-
Heat Maps
-
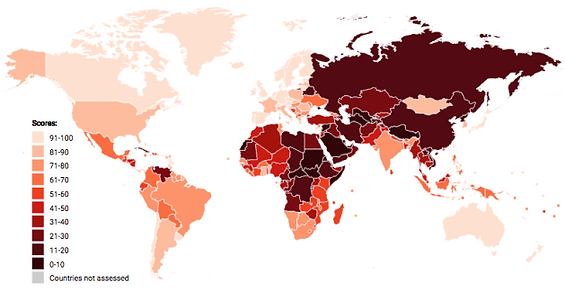
Geographic Maps,
-
Funnel Charts
-
Decomposition Trees...and more!
-
-
If needed, dynamic capabilities that would allow for different views of the data, without having to navigate to another page - may also be built in, using"drop down", "toggle" and "slicer" filter buttons.
-
For example, if you wanted to see the "Total Net Sales by Period" for your company, and on the same page, also be able to filter these sales for a particular dimension, such as"Business Unit", or "Client", or toggle between different measures, like: "Actual Net Sales", "Budgeted Net Sales", "Forecast Net Sales", or even choose how these sales were aggregated across time, between "MTD", "QTD, or "YTD" time periods - this would be possible. (This has been a request from a Venture Capital, and Marketing & Advertising organisation in the past!)
-
Building powerful Data Models to deliver precisely the insights you need!
-
A well-designed Data Model sits at the very heart of the any "Visual Data Analytics & Business Intelligence" solution. Depending on what you need to track, and after we have cleaned and tranformed any data sources, our next step is to then create a Data Model that best meets the specific data reporting needs.
-
Data Models can range from:
-
Financial & Investment Models (for example, when you want to be able to easily compare Actual vs. Budget vs. Forecast: Profit & Loss, Balance Sheet, or Cash Flow Measures)
-
H.R. & Operational Models (for example, when you want to be able to easily track operational measures such as: Staff Utilisation, Staff Absenteeism, Overtime Hours, or Average Delivery and Handling Times)
-
Commercial Models (for example, when you want to monitor more commercial measures about your products and customers, such as: Percentage of Sales from your Top 5 Customers or Products; or Identification of your Top 10 Most Profitable Customers, and how their profitability has been changing over time)
-
Other Beskpoke Business Models (for example, where you might want to track metrics on Inventory Levels, or Sales Levels of Top Performing Staff, and so on)
-
We build these Data Models, using three main technologies: DAX, Power Pivot, and Power BI
- DAX: (or Data Analysis Expressions) is a powerful Data Analysis language, that comprises of a library of functions and operators that can be combined together, to build formulas and expressions (or more formally known as "DAX Measures"). These DAX Measures are needed to produce dynamic and interactive Visual Reports
- Power Pivot: is the working area within Power BI, where different Datasets can be connected, (using the software's own in-built Data Modelling Engine), to produce a "DAX Data Model", (designed following a "Fact" and "Dimension" table like Data Architecture). A DAX Data Model is needed, before any underlying Data can be easily visualised (for example, through Graphs, Charts, and Numerical Tables).
-
Power BI: is one of the world's leading Data Analytics and Visualisation tools. The software was developed by Microsoft, to provide organisations with interactive visualisation and business intelligence capabilities. It has consistently been ranked as the market leading Data Analytics and Visualisation software, in terms of "Completeness of Vision", and "Ability to Execute" by Gartner, the market research firm, in their Magic Quadrant study of all BI and Data Analytics softwares


HOW WE DO WHAT WE DO?
A plan for connecting data from both inside and outside your organisation!
-
We do what we do by helping collate and transform data that sits both inside your organisation (e.g. within and across business functions) and outside your organisation (e.g., if you are an investment company that needs to consolidate and track the performance across several separate portfolio companies).
- We do this in a variety of ways. Principally,
- By first understanding, and developing a plan for collating and combining your existing Customer, Operational, Supplier, Sales, Marketing, Procurement, or Financial Data Stores to produce a set of Clean & Useable Datasets
- These may include: data stored in SQL Databases, data stored in Accounting Packages such as QuickBooks or Xero, data from ERP systems such as Microsoft Dynamics, data from Financial Consolidation Systems, such as SAP, or data exported to offline computer Files and Folders (typically from Microsoft Excel, or Adobe PDFs), data from H.R. systems such as Cezanne or Bamboo
-
Then, provided the data can be accessed and read, implementing and executing on this plan by:
-
Using advanced ETL technologies, such as Power Query, and M-Code, then also, if necessary, by
-
Incorporating other automation languages such as Visual Basic for Applications, Microsoft Flow, SharePoint and Pytho...
-
- By first understanding, and developing a plan for collating and combining your existing Customer, Operational, Supplier, Sales, Marketing, Procurement, or Financial Data Stores to produce a set of Clean & Useable Datasets


Providing you with Statistical Insights!
Once a Data Model has been built, in addition to graphical visualisations that can be created, (as described above), we can also apply basic statistical techniques to provide a better statistical understanding of the data.
For example, by performing simple:
-
Trend
-
Regression /Correlation analyses
Or, by implementing some of the new
-
Natural Language Processing and Artificial Intelligence features that are being developed that would allow for the automatic generation of visuals - (on the fly) - from user typed questions
Share and Collaborate your findings, securely, with key stakeholders!
-
Once a set of "Visual BI Reports & Dashboards" have been created, we can also provide several options for sharing this data, as you work towards creating a culture of data collaboration, and extending the impact of your insights.
-
For example:
-
We can help share Reports & Dashboards with key stakeholders (either inside, or outside your organisation), by creating secure Power BI "Workspaces", that can be accessed online (from devices such as: Computer, Laptop, Tablet, or Mobile Phone)
-
We can also help create customised User Groups, for example, if your organisation uses Azure Active Directory, to control exactly which stakeholders and users you provide access to (i.e. whether "Read Only", or "Full Read and Edit")
-
We can also help embed Reports & Dashboards into their own web pages, using Power BI Embedded, if, for example, you would like to manage user access, through your own website's own authentication page (rather than through Power BI's online service, using Power BI "Workspaces")
-
Why Us?
We believe we have some of the three key ingredients for success:
PASSION & DESIRE:
We hold a deep and genuine interest in the Engineering & Technology, and Media & Entertainment, (with experience too of working in the Renewable Energy, Healthcare, Retail, and FMCG) sectors. We are passionate about bringing our clients’ (and business partners’) ambitions to life, so that they can continue on their business journey. We wouldn't have begun this effort, or started this company if we didn't!
SELF-IMPROVEMENT MENTALITY:
We are energetic workers, open to invention, and hold a continuous improvement mind-set. Stasis, Stagnation, The Status Quo don't appeal to us! This is why, everyday, we come to work, with a real drive to inspire: (i) professional excellence, (ii) continuous adoption of the "state-of-the-art", and (iii) real commitment to help our clients to deliver growth and results.
We operate with a growth culture mind-set, learning from collective successes and failures, from every customer, and every project we work on - so we can maintain a definitive and true mastery of our work.
EXPERIENCE:
We have amassed considerable experience (both formally, and through our own working lives) - so have a "fair amount" of technical ability and know-how to help you!
Our aspirations are, ultimately, to maximize the utility delta (of what's out there) against the current state-of-the-art, ideally for the largest number of people, so we can truly and boldly help you go where no other company has gone before!
Finally, whatever we do, we aim to do with a curiosity, and perseverance - to the very highest levels of excellence - working both rigorously and artistically.


Our mission: to support businesses around the world – small, medium-sized, or large, so that they can realise their full potential... and more!
We want to win the trust and loyalty of companies (particularly visionary and futuristic companies in the Media & Entertainment, and Engineering & Technology sectors), by building secure, flexible, robust and re-usable systems, so they can surprise and delight their customers!

Our vision: to create an amazing experience for our customers, get them to think differently, in the relentless pursuit of the "better" - for the benefit of the economies they operate in, communities they support, and societies they live in!

Our values are a codifcation of our ambitions and beliefs:
-
We hold a “team first” mentality: we value inclusion, uniqueness, diversity of thought, and collaboration. We know that ideas are richer and execution is stronger when everyone feels included.
-
We make sure we take care of ourselves: This includes each other, and the communities in which we operate.
-
We focus on our customers: We start with the customer and work backwards to earn and preserve customer trust. While we pay attention to competitors and listen to our advisors. our sole focus is to make our customers successful.
-
We have grit: We exhibit firmness of character and indomitable spirit when faced wilh challenges. We consistently back ourselves and inspire our teams to power through the low moments. We have a genuine care for our customers and we are quick to spot when team mates need help. In moments of difficulty we remain calm and collected, allowing us to find the best solution: we don’t let our judgement be clouded by personal anger, stress or worry.
-
We move fast: We believe in our work’s ability to change human lives. Because the cost of indecision can be more than the cost of a wrong decision, we emphasize high-speed decision making and execution while insisting on the highest standards. We accept that it’s normal for things to go wrong but we work hard to correct issues we encounter. We are natural optimists and believe it is always possible to succeed.
-
We earn trust: We are self-motivated and dependable, and build environments of trust. We’re humble individually, and proud together. We are trusted to manage our own schedule and priorities - choosing to work from home, if needed, but also being sensitive to team dynamics, and being present for others. Our team mates trust us to give them direct and honest feedback. We hyperfocus on inclusiveness, direct communication, ownership and being vocally self-critical.
-
We deep dive: We dive deep to understand the problem, enforce accountability and drive clarity. We are flexible in using our skills to do whatever it takes to achieve our goal. No task is beneath us. We have a strong desire to learn and continuously improve – seeking out feedback from others to develop ourselves positively. We are open and show and share personal weakness in order to overcome it. We don’t take ourselves too seriously!
-
We stay hungry: We are eager to solve challenging problems and acquire new skills. We understand that staying on the bleeding edge is hard work and are committed to invest in our continual development.
-
We are truth seeking: We always look through blockers and challenges to get to the fundamental issues and truths of a situation. We are not afraid to challenge authority. We may have strong opinions, but we hold them lightly and listen to others. We pride ourselves in our ability to sensitively and directly speak the truth to each other and our customers. Wherever we are or whomever we are talking to we are clear: the best idea always wins.
-
We are engineers and designers at heart: we hold the products we craft to the highest standard and believe that exceptionally engineered solutions are the cornerstones of establishing trust. Today there is a complex system of data systems, data warehouses, analytics engines, that can seem daunting to any newcomer. We believe in making our solutions simple, focused, and immediately understandable!
We are not trying to change the world or target the entire global market - every customer is not our customer! We are here though to help a small and ambitious niche - to whom we believe we can truly make a difference. This, we believe, makes our importance truly unique!
Therefore, if you're excited about the Engineering & Technology, Media & Entertainment, Renewable Energy, Retail, or Healthcare sectors, and expanding the art of the possible through creative exploration, and share our belief in the importance of these sectors to our future, then you also believe in our mission, and our vision for an exciting future!... and we would welcome a conversation with you!


Supplementary Services
We don’t stop with "Visual Data Analytics & Business Intelligence, or even for that matter "Data Science, Data Engineering, A.I. or Machine Learning".
We are restless spirits, here to help all sizes of business, large AND small!
We recognise that many businesses (especially small start-ups) are simply unaware of the administrative mountains that need to be surmounted to get their ventures up and running. It's work you may not have ever heard of (or even want to hear of!), but which still needs to get done!
We can also help provide further advice and support in one of the following areas:
-
Starting a Limited Company
-
Creating and Managing a set of Business Accounts (both Management and Statutory)
-
Creating valuation, scenario & sensitivity models (layered with strong business logic) to assist with any upcoming Commercial, Operational, or Financial Deal Negotiations
Some of these are statutory or government requirements (often for good reason!), or just things needed by your investors (your Local Bank, Angel Investors, VC's, PE houses, Investment Banks, etc.) But they are also things that will help you manage your own progress (e.g. when monitoring your own business' performance)
Without the right expertise, it can be a painful and time-consuming experience, and will either frustrate you, or detract you from the other things you could be more focused on, such as: scintillating your Customers, providing training, learning & development opportunities for your Employees, growing your Sales force, improving your Product and/or Service offering, upgrading your Internal Systems, developing your Marketing and Brand Identity, pursuing Acquisitions, engaging in Strategic Partnerships - and making a true and lasting Societal difference!