


WHO ARE WE?
We are a business & technology company, focused on creating high quality Data Visualisation & Business Intelligence solutions for organisations that want to improve their business performance.
We know in this domain that the smallest marginal gain can make the biggest difference, and why we want to help our clients achieve this edge by combining the expertise we have in data analytics, with elegant design, robust engineering, and our knowledge and experience of business.
We endeavour to be straight up with what we offer, (delightfully surprise when we can!), but most of all, dedicate ourselves, completely in trying to create smart, disruptive, and accurate solutions, to challenging real-world problems

WHY WE DO WHAT WE DO?
We genuinely believe we are on the cusp of a golden renaissance. With new developments and discoveries being made almost EVERY day, in areas such as: AI, Robotics, Autonomous transport, Sustainable Energy, Bio-Life Sciences, Augmented & Virtual Reality, to Wireless Connectivity – ALL of our LIVES are truly being transformed!
In this highly data-driven age, we believe that a critical challenge that many organisations face is the ability to make sense of, and drive critical decisions from all the data that surrounds them. We're on a mission therefore to help businesses of all sizes (whether you're a small, aspirational entrepeneur, an investment company, or large corporate) make better sense of their own business data, so that decisions can be made quickly, accurately, and in a more informed way.
As we do this, we endeavour to work with a strong customer orientation, and platonic desire to deliver the very best possible solution, to you, our customer. And we hope this passion and drive is also reflected by what you see, here, on our website


SECTORS WE FOCUS ON
No project is ever the same; we have worked across multiple sectors from all over the world, but currently, we focus on developing solutions for organisations in the the following sectors.
1. Engineering & Technology
2. Media & Entertainment
3. FMCG & Retail
4. Healthcare
5. Renewable Energy
6. Education
WHAT IS DATA VISUALISATION & BUSINESS INTELLIGENCE?
"Data Visualisation & Business Intelligence" is set of activities that involves aggregating raw data from different sources (through APIs and other kinds of data pipelines), and then cleaning and transforming this data to build a single and unified data model so that patterns, associations, and trends, hidden within this data, can be more more easily visualised and understood.
Data Visualisation & Business Intelligence tools, if applied in the right way, can provide mew insights and save significant amounts of time, especially if your data is in a confusing layout, or does not have all the requisite components to perform a fast, accurate, complete, and meaningful analysis.
In particular, such tools can help:
-
Save large amounts of time, particularly if your data often needs to be cleaned first, and regularly grouped, or joined with other sources
-
Simplify manual data workflows, into efficient & automated repeatable processes, if for example, data resides across several files or folders, or online sources, and needs to be re-collated and refreshed on a frequent and predictable basis, at set times (e.g. daily, weekly, monthly, or annually)
-
Display data, visually, in reports and dashboards, in a very dynamic way, if different configurations or views of the data, needs to be seen, e.g. through simple, intuitive, and easy to use 'drop down' filters, 'toggle' and/or 'filter' buttons
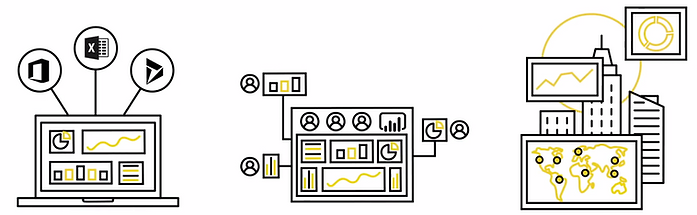
We summarise what we mean by "Data Visualisation & Business Intelligence" as a sequence of four main steps, shown below. This starts with:
-
Building data pipelines to aggregate disparate sources of raw data; to then
-
Transforming this aggregated data into a set of cleaned datasets; to next
-
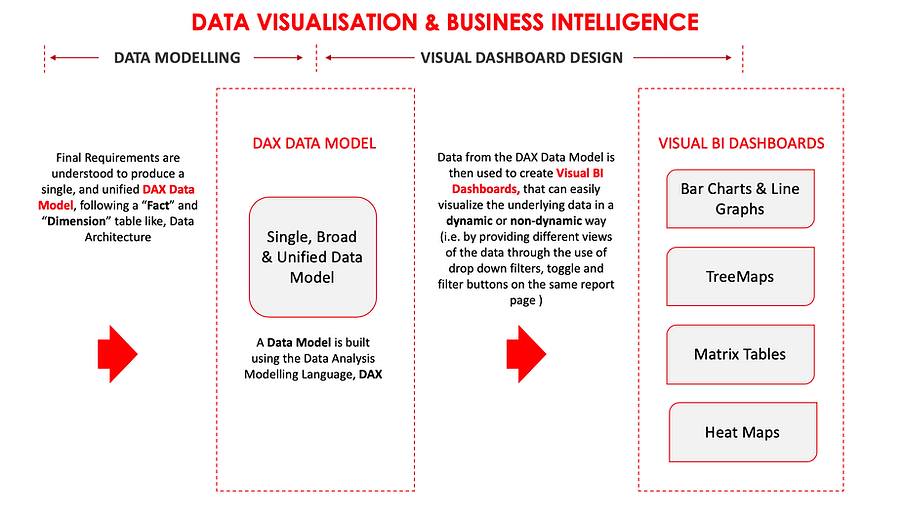
Constructing a data model from these datasets to produce a single unified data model, from which"KPIs" can be defined and tracked; to finally
-
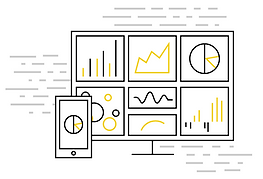
Creating a series of dynamic "Visual Business Intelligence Reports" that can quickly and easily visualise these"KPIs" (through graphs, charts, numerical tables, decomposition trees, etc.)
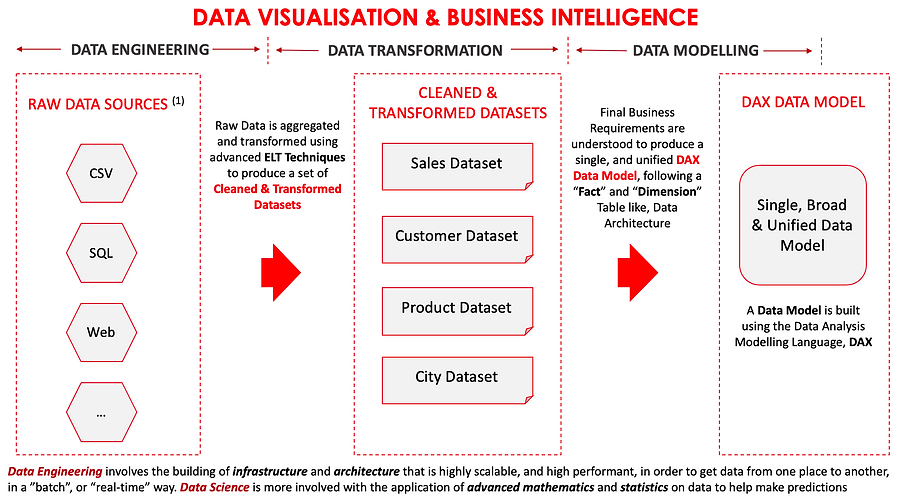
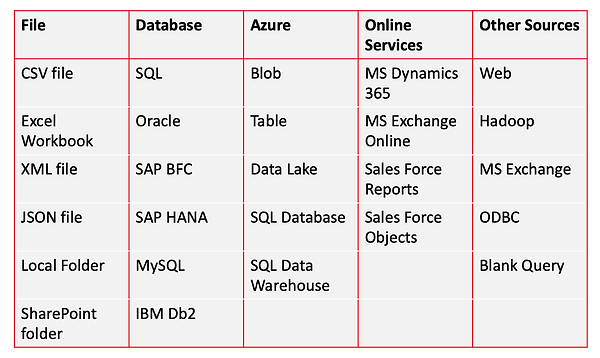
Raw Data Sources
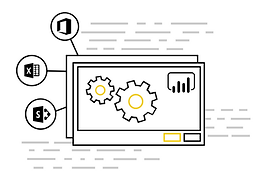
The raw data used can be obtained from any number of sources, ranging from: flat files such as Excel and CSV files; files and objects within Windows and SharePoint folders; structured databases such as SQL; Big Data sources such as Hadoop and Azure Data Lake; SCM, CRM, and ERP systems such as MS Dynamics and Sales Force; to other data sources and websites, directly from the Internet
OUR APPROACH - A 5-STEP PROCESS
We follow a repeatable 5-step process: to transform COMPLEX and/or DISPARATE DATA into ONE VERSION OF THE TRUTH!
The products are our lifeblood, but we don’t license them. They are either open-sourced or available as part of the work we do.
1. DATA PREPARATION
2. DATA MODELLING
3. VISUAL BI DASHBOARDS
4. SHARE & COLLABORATE
5. REAP THE REWARDS
Extract, load and transform raw data into Cleaned and Transformed Datasets
Connect multiple Cleaned Datasets to create one single, broad, & unified DAX Data Model
Create Interactive Dashboards, that allows this data to be easily visualised, in a dyanmic or non dynamic way
Share data and insights with other key stakeholders, securely, online, through the cloud, and/or across other devices
Watch factual & data-driven decisions spread like wildfire!


WE AIM TO DESIGN FOR YOU, AND SCALE FOR YOUR ENTERPRISE!
We believe that when you make working with data easy, fun, and impactful, amazing things can happen, and why our goal is to help visionary and futuristic organisations, to try and make data a more useful part of their employee's working lives.
To this end, we want to help companies in the following ways:
CREATE A DATA CULTURE FIT YOUR ENVIRONMENT
By designing and building reports that can:
-
Extract, load, and transform data from multiple ERP and DataWarehousing systems
-
Be deployed either to an accessible Online Workspace, or On-Premises, so key stakeholders within the organisation can access them
- Extract insights, faster, on the fly, through the use of Natural Language Querying and Artificial Intelligence
DELIVER ON A PROMISE OF POWERFUL ANALYTICS
By helping to untangle some the thorniest of business questions you might be facing.
Currently, we:
-
Design our Dashboards using the fatest data processing systems in the industry: "Microsoft's xVelocity and VertiPaq engines" - the current market leader in in-memory analytics and data compression. This means that Datasets with millions - even billions - of rows, can be easily, and quickly handled.
-
Construct our "Data models" using the popular Data Analytics language: DAX - a powerful analytics language that can be created to uncover almost any pattern, trend, or associations from large volumes of data
-
Use other complimentary Data Services, such as "Azure Dataflows" to help better automate and refresh Business Intelligence Reports, for example, if data sources change frequently.
PUBLISH & CONSUME CONTENT, FAST AND WITH SCALE!
To give you the capability to distribute your insights on a wide range of devices, for example, by:
-
Giving secure access to reports from devices that can be annotated, so you can keep your team involved
-
Giving greater control over which individuals and businesses reports are shared with - both inside and outside of the organisation
-
Helping quickly, and securely, distribute any pre-built dashboards you may have, using data from other vendors, such as: Xero, Quickbooks Online, and SalesForce
GOVERN SECURELY WITH A MISSION CRITICAL PLATFORM
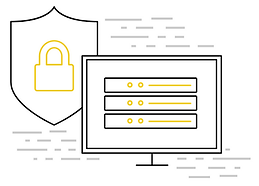
To strive to maintain the highest levels of data handling, governance and information security, by improving data governance and security, for instance, by:
-
Using only approved vendors that meet stringent industry compliance standards and benchmarks (e.g. applications from Microsoft), so your data is well safeguarded
-
Creating secure online Workspaces, so 'Report sharing' can be controlled, (e.g. who you give "read only" or "full edit" access to)
-
Giving futher control over what different users can see, even when accessing the same Dashboard
-
Making use of any possibly pre-existing "Azure Active Directories", so User Groups can be created to more easily manage who Dashboards are shared with (e.g. groups of users vs individuals)
PAST CLIENTS using "Data Visualisation & B.I." solutions
Our past clients have ranged from companies in the Media, Technology, Marketing & Advertising, Automotive, Retail, and Healthcare industries. These have included:
1. Omnicom Media Group - one of America's largest global media, marketing and corporate communications companies
2. Diageo - the world's largest producer of spirits and a key producer of beer
3. W.P.P. - one of the world's most prestigious professional marketing and communications company
4. Carrefour - the Middle East's largest multinational Retailer
5. The Landmark Group - the Middle East's 2nd largest multi-national Retailer
6. Jaguar Land Rover - One of the UK's most prestigious automotive companies
7. JL Rohatgi Hospital - a district eye hospital that provides high quality eye care at an afforable low cost to the disadvantaged and underpriviledged
If you would like to find out more about our past customers and work, then please visit our customer page here:
INTERESTED IN FINDING OUT MORE?
If you would like to find out more about how we can help, then please contact us with more details of your business problem, or any initial ideas you might have of a "Visual Data Analytics & Business Intelligence" solution you would like to implement.
If it further helps clarify your needs or generate new ideas, we would be happy to go through and shre some successfully implemented past examples, and provide an estimate of approximate costs, along with a timetable for delivery.
Whilst our prices aren't extortionate, we do believe in charging a "fair" market price, for delivering a re-usable, rapidly deployable, and high quality "Data Visualisation & Business Intelligence" solution. We flexibly follow both time-based (by the hour), and fixed/project-based, pricing models.
Lastly, if we feel like we need extra help, we will try and partner with other research, technology, or science institutions, to try and get exactly what you need!
Please contact us directly, using the form below, or by emailing us directly at: sachin.tandon@startech-enterprises.com:
We look forward to hearing from you!
CONTACT US TODAY!
Trusted Partner Network

HOW WE CAN HELP WITH YOUR SITUATION?
YOUR ORGANISATION SITUATION:
Whatever your organisation situation may be, we want to help teams and departments deliver accurate, valuable insight across their organisation, fast!
Whether you are:
-
A small to medium sized company going period of rapid growth and international expansion, and struggling to get the right reports out the door fast enough, perhaps because of your own still maturing ERP systems, or
-
Already a large global company going through significant restructuring, and/or merger and acquisition activity, that you quickly need to get high quality analytics and reporting systems in place, for your newly formed departments
-
An educational institution in need of modernising your existing management information and reporting systems...
...we are here to help!
We have worked with organisations the world over, from large global multi-nationals, medium sized enterprises, to small start-ups, designing and delivering advanced, in some cases, A.I driven "Business Intelligence" reports, that have allowed for quicker, more informed, more engaging, and more transparent business decision-making.
MULTI-DISCIPLINARY BUSINESS DATA:
We know that the most valuable insights often happen at the boundaries of different disciplines, methods and techniques. Our appreciation for this has come from working across many different industries, departments, and types of data, over the years, covering:
-
Finance
-
Human Resourcing
-
Sales
-
Marketing
-
Procurment
-
Manufacturing
-
IT
-
Operations
OUR TRACK RECORD:
We have been operating for 5 years, providing a variety of solutions, with a now established repeatable process that combines a variety of techniques (from basic Data Engineering, Data Transformation, and Data Modelling to Visualisation) to cater for different needs.
We take the following approach to uncover insights from data:
-
Aggregating, transforming, and cleaning raw business data from a variety of disparate sources using reliable and proven Extract, Load, & Transform (ELT) techniques, to produce a set of "Cleaned & Transformed Datasets"
-
Connecting these "Cleaned & Transformed Datasets" to create a single unified "Data Model"
-
To finally, using this "Data Model", to design and build a set of"Visual Business Intelligence Reports" to from which patterns and insights (e.g. through Bar Charts, Line Graphs, Matrix Tables, Heat Maps, and TreeMaps) can be explored in a very Dynamic way
WE WANT OUR CLIENTS TO HAVE:
-
So they can:
-
Connect and visualize their data (in hours and minutes, rather than months or weeks)
-
Uncover hidden insights more quicky, robustly, and flexibly (through well-engineered data models)
-
-
So they can connect data from multiple and disparate business sources. Anything from:
-
Financial Data
-
(e.g. from Accounting softwares (Xero, and Quickbooks), or other enterprise grade financial systems (such as those from Microsoft, Amazon, and SAP)
-
-
Timesheet and Human Resourcing Data
-
(e.g. from Bamboo HR, Traffic Lite, Dash, Maconomy, CMAP)
-
-
Commercial Data
-
(e.g. from common ERP systems, such as Microsoft Dynamics, SAP Business One, Oracle ERP)
-
-
Other Organisational Data
-
(e.g. Marketing, Insurance, Medical, Education, and Government data, etc.)
-
-
-
So they can:
-
Combine multiple views of data to get to a smarter, and more holistic view of their business.
-
Do this in a way that harnesses their employees' natural ability to spot visual patterns quickly, so they can take action in a timely manner
-
-
So they can:
-
Share and publish smart reports and dashboards, across their organisation to key stakeholders, either on the web, or on other mobile and digital platforms, so more timely, more informed, and more considered decisions can be made
-

FAST ANALYTIC CAPABILITIES
MULTI-DATA SOURCE CAPABILITIES
SMART DASHBOARD CAPABILITIES
BETTER COLLABORATION & SHARING CAPABILITIES

CALL US
Tel: +44 77 6996 3115
EMAIL US
OPENING HOURS
Mon - Fri: 7am - 10pm